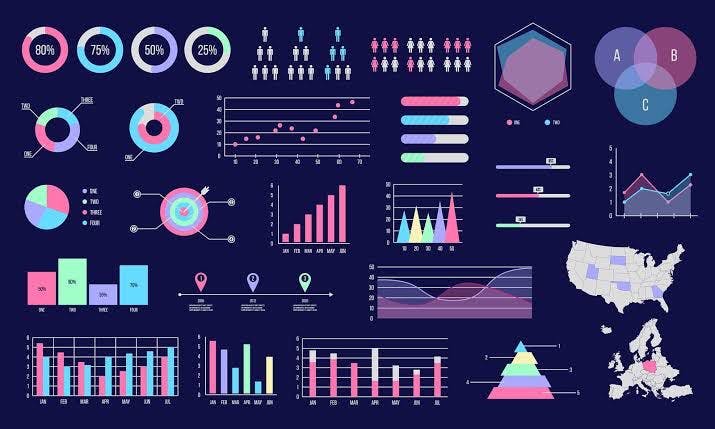
We live in a Data filled world. From the point where one gets off his/her bed, to the moment of return, Data is generated. Being a digital century, the advent of technologies has made Data generation more rapid.
It is not enough to generate Data. As a matter of fact, Data in its raw form is useless. In our data-rich age, understanding how to analyze and extract meaningful insights from our business’s digital insights is one of the primary drivers of business success.
The business world is blossoming.
More people are venturing into businesses. These businesses and organizations need Data insights to be able to meet customers' needs.
What Is Data Analysis
Data analysis is the process of collecting(gathering), modeling (structuring), and analyzing (processing) data to extract (generate) insights that support decision-making. There are several methods and techniques to perform analysis depending on the industry and the aim of the analysis.
simple enough right...
However, putting the above in a simple way, we'd say Data Analysis involves gathering many scattered and unorganized events into a whole, picking out irrelevant/unrelated events, and arranging the related ones into a pattern that is easily understood.
Once such pattern is formed, it it then investigated to generate meaningful information capable of being used to solve future problems in such aspect.
How Is This Done
I know you're probably wondering what steps to take to arrive at this insights. As I already mentioned, Data in its raw form isn't desirable, that is why we have special people who ensures that Raw Data is made Desirable. These People are called Data Analyst, Engineers, or Data Scientists.
I will walk you through the process.
let's get started...
My name is Nse, I am a Data Analyst, this morning, my Boss sent an email concerning the company's decline in sales.
In his words, "Nse, we need to understand what our customers want, we need to satisfy them...tell us how to solve this problem"
This is a typical Data Analysis problem and we're solving this together in five simple steps...
Ask Questions: to solve a problem, we first try to understand a few important facts in respect to the issue. We do this by asking relevant questions in order to better understand why the decline is happening, when it started, and what exactly is to be done to get the customers' coming.
After answering the questions above, I will go ahead to gather relevant data that would aid in the problem solving.
This is achieved by scraping web servers, logs, online materials, databases. simply put, finding the right data set that best solves the problem.
In my case, I will look through our sales records, social media media pages, competing firms and their sales rate, etc This process is called Data Generation.
- After gathering these data from these sources, a process called Data Cleaning, takes off.
Data cleaning is a process of making raw data suitable for analysis, this involves fixing missing values, removing duplicate values, fixing inconsistent datatypes, and misspelled attributes.
HURRAY!!! The data is clean
I will move on to carry out exploratory data analysis, this step involves defining what data variables to use for model development. By variables I mean a data item that may take on more than one value during the runtime of a program/event.

- In the data modeling process, different techniques are applied to identify the model that best fits the business requirement. it is at this point that I will train and test the models and then select the best performing model, this is performed with either Python, R, SPSS, Excel, or Saas.
- Data Analysis isn't complete without visualization and communication.
Through the help of the model, I have been able to find out why we are experiencing a decline in sales. I need to call my boss immediately, but before then, A report or dashboard explaining these insights must be made.
The insights generated from the model is communicated in the best way that will help stakeholders take appropriate business decision.

For the visualization, tools like Tableau, Power Bi, or QlikView can be used to build powerful dashboards and reports.
Just with the steps above, I have been able to solve our Sales Problem. I feel happy.
YOU TOO CAN DO IT. THE WORLD OF DATA NEEDS YOU
Part Two of this series will explain What Tools to Learn as a Beginner in Data Analysis.
